The Keynesian approach and the IS-LM model
| Professeur(s) | |
|---|---|
| Cours | Introduction to Macroeconomics |
Lectures
- Introductory aspects of macroeconomics
- Gross Domestic Product (GDP)
- Consumer Price Index (CPI)
- Production and economic growth
- Unemployment
- Financial Market
- The monetary system
- Monetary growth and inflation
- Open Macroeconomics: Basic Concepts
- Open Macroeconomics: the Exchange Rate
- Equilibrium in an open economy
- The Keynesian approach and the IS-LM model
- Aggregate demand and supply
- The impact of monetary and fiscal policies
- Trade-off between inflation and unemployment
- Response to the 2008 Financial Crisis and International Cooperation
As we have seen in the previous chapters, in the long run, we have assumed that prices are perfectly flexible. The level of output of an economy was therefore determined by the technology of production and the availability of the factors of production: labour, capital, and so on. Thus, neither monetary policy (changes in the money supply) nor fiscal policy (changes in government spending) could affect the long-term level of output of an economy, given the full employment of all factors of production.
Conventional economics therefore focuses on this long-term level of output and leaves very little room for an active monetary and/or fiscal policy. According to this approach, if the level of production away from full employment is not reached, the economic system has, on its own, the necessary forces to achieve its long-term equilibrium again without external intervention. But...
As the English economist John Maynard Keynes said in the first half of the 20th century: « In the long run, we're all dead ». On the other hand, economic systems are confronted with short-term economic fluctuations that cause a decrease or increase in economic activity below or above its long-term level of full employment → theory of fluctuations (IS-LM model and aggregate demand and supply model).
With the last economic crisis and the ensuing recession, the positions of Keynes, who advocated active state intervention in economic life and policies to stimulate aggregate demand in the event of a recession without waiting for the long-term equilibrium to recover on its own, have become topical again.
In this chapter we will formalise Keynes' view of the functioning of the market for goods and services and the money market by means of a graphical analysis. We will then integrate the equilibrium of these two markets by developing the IS-LM model proposed by Hicks, winner of the Nobel Prize for Economics (1972).
Inflationary and deflationary gaps and the 45° model (or income-expense model)[modifier | modifier le wikicode]
Planned versus actual decisions[modifier | modifier le wikicode]
Firms and consumers make decisions based on forecasts and expectations that do not necessarily come true.
When we speak of desired or expected savings, investment and spending, we are referring to the actions planned by firms and households (or ex ante decisions). When we speak of realised savings, investment and expenditure, we are referring to events that have actually taken place (or ex post events).
There is no reason why national income should coincide with income from full employment.
In the following we indicate with Échec de l’analyse (MathML avec SVG ou PNG en secours (recommandé pour les navigateurs modernes et les outils d’accessibilité) : réponse non valide(« Math extension cannot connect to Restbase. ») du serveur « https://en.wikipedia.org/api/rest_v1/ » :): {\displaystyle E = C + I + G + NX} the total (expected) expenditure of the economy.
The consumption function[modifier | modifier le wikicode]
The level of consumption expenditure depends directly on income, or, more exactly, on disposable income, Échec de l’analyse (MathML avec SVG ou PNG en secours (recommandé pour les navigateurs modernes et les outils d’accessibilité) : réponse non valide(« Math extension cannot connect to Restbase. ») du serveur « https://en.wikipedia.org/api/rest_v1/ » :): {\displaystyle Y_d = Y - T} , where Échec de l’analyse (MathML avec SVG ou PNG en secours (recommandé pour les navigateurs modernes et les outils d’accessibilité) : réponse non valide(« Math extension cannot connect to Restbase. ») du serveur « https://en.wikipedia.org/api/rest_v1/ » :): {\displaystyle T} indicates the taxes levied by the state (=> here they are exogenous). Under the linear function assumption, the aggregate consumption function is therefore :
- Échec de l’analyse (MathML avec SVG ou PNG en secours (recommandé pour les navigateurs modernes et les outils d’accessibilité) : réponse non valide(« Math extension cannot connect to Restbase. ») du serveur « https://en.wikipedia.org/api/rest_v1/ » :): {\displaystyle C = C(Y_d)= C(Y - T) = C_0 + pmc \times (Y - T)}
where Échec de l’analyse (MathML avec SVG ou PNG en secours (recommandé pour les navigateurs modernes et les outils d’accessibilité) : réponse non valide(« Math extension cannot connect to Restbase. ») du serveur « https://en.wikipedia.org/api/rest_v1/ » :): {\displaystyle C_0} is the level of "incompressible" consumption, i.e. below which one cannot survive and pmc indicates the marginal propensity to consume = the share of income that is used to finance consumption and that is not saved (Échec de l’analyse (MathML avec SVG ou PNG en secours (recommandé pour les navigateurs modernes et les outils d’accessibilité) : réponse non valide(« Math extension cannot connect to Restbase. ») du serveur « https://en.wikipedia.org/api/rest_v1/ » :): {\displaystyle pmc = \frac {\Delta C}{\Delta Y}} .
Slope of function Échec de l’analyse (MathML avec SVG ou PNG en secours (recommandé pour les navigateurs modernes et les outils d’accessibilité) : réponse non valide(« Math extension cannot connect to Restbase. ») du serveur « https://en.wikipedia.org/api/rest_v1/ » :): {\displaystyle \frac {\Delta C}{\Delta Y} = pmc}
If, for example, Échec de l’analyse (MathML avec SVG ou PNG en secours (recommandé pour les navigateurs modernes et les outils d’accessibilité) : réponse non valide(« Math extension cannot connect to Restbase. ») du serveur « https://en.wikipedia.org/api/rest_v1/ » :): {\displaystyle pmc = 0.6} (=60%), this means that 60% of an increase in income is allocated to consumption and 40% is saved (and pms = marginal propensity to save = 40%).
Equilibrium[modifier | modifier le wikicode]
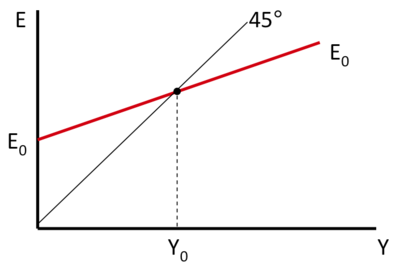
Since consumption is an increasing function of income, Échec de l’analyse (MathML avec SVG ou PNG en secours (recommandé pour les navigateurs modernes et les outils d’accessibilité) : réponse non valide(« Math extension cannot connect to Restbase. ») du serveur « https://en.wikipedia.org/api/rest_v1/ » :): {\displaystyle C(Y_+)} , it follows that E is also an increasing function of Y.
Concerning the other components of total expenditure, we will here assume that investment does not depend on Y. Moreover, for the moment, we will also disregard the fact that Échec de l’analyse (MathML avec SVG ou PNG en secours (recommandé pour les navigateurs modernes et les outils d’accessibilité) : réponse non valide(« Math extension cannot connect to Restbase. ») du serveur « https://en.wikipedia.org/api/rest_v1/ » :): {\displaystyle M} is positively dependent on income level; public spending decisions are the responsibility of the government and are also made here as exogenous, as are exports, which are dependent on foreign income.
The economy is in equilibrium when total demand is equal to national income Y => when the line representing total planned expenditure crosses the line at 45° (= actual expenditure).
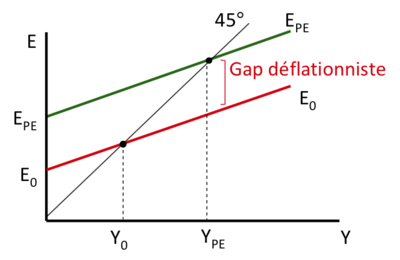
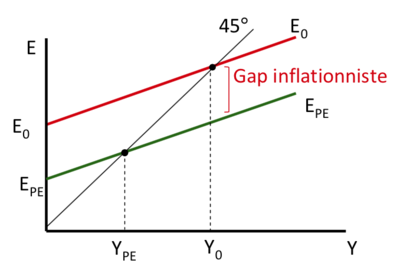
Being Échec de l’analyse (MathML avec SVG ou PNG en secours (recommandé pour les navigateurs modernes et les outils d’accessibilité) : réponse non valide(« Math extension cannot connect to Restbase. ») du serveur « https://en.wikipedia.org/api/rest_v1/ » :): {\displaystyle Y_{PE}} full employment income, two cases can occur in the short term ...
Gaps[modifier | modifier le wikicode]
Deflationary Gap[modifier | modifier le wikicode]
Income is less than full employment income (=> unemployment) and the total expenditure it would take to reach Échec de l’analyse (MathML avec SVG ou PNG en secours (recommandé pour les navigateurs modernes et les outils d’accessibilité) : réponse non valide(« Math extension cannot connect to Restbase. ») du serveur « https://en.wikipedia.org/api/rest_v1/ » :): {\displaystyle Y_{PE}} is greater than the actual expenditure.
Inflationary Gap[modifier | modifier le wikicode]
Income is higher than full employment income (=> inflationary pressures) and the total expenditure it would take to reach Échec de l’analyse (MathML avec SVG ou PNG en secours (recommandé pour les navigateurs modernes et les outils d’accessibilité) : réponse non valide(« Math extension cannot connect to Restbase. ») du serveur « https://en.wikipedia.org/api/rest_v1/ » :): {\displaystyle Y_{PE}} is smaller than the actual expenditure.
Budgetary policy and the Keynesian multiplier[modifier | modifier le wikicode]
The government can influence the components of demand through monetary and fiscal policies (see below + following chapters) in order to bring the market equilibrium closer to full employment income.
When the government changes its spending, for every franc more (less) spent, total expenditure increases (decreases) by more than one franc. This is known as the multiplier effect.
Why is this called a multiplier effect? We know that Échec de l’analyse (MathML avec SVG ou PNG en secours (recommandé pour les navigateurs modernes et les outils d’accessibilité) : réponse non valide(« Math extension cannot connect to Restbase. ») du serveur « https://en.wikipedia.org/api/rest_v1/ » :): {\displaystyle Y = E = C(Y) + I + G + X - M} . If Échec de l’analyse (MathML avec SVG ou PNG en secours (recommandé pour les navigateurs modernes et les outils d’accessibilité) : réponse non valide(« Math extension cannot connect to Restbase. ») du serveur « https://en.wikipedia.org/api/rest_v1/ » :): {\displaystyle G} increases, Échec de l’analyse (MathML avec SVG ou PNG en secours (recommandé pour les navigateurs modernes et les outils d’accessibilité) : réponse non valide(« Math extension cannot connect to Restbase. ») du serveur « https://en.wikipedia.org/api/rest_v1/ » :): {\displaystyle Y} increases, which will increase Échec de l’analyse (MathML avec SVG ou PNG en secours (recommandé pour les navigateurs modernes et les outils d’accessibilité) : réponse non valide(« Math extension cannot connect to Restbase. ») du serveur « https://en.wikipedia.org/api/rest_v1/ » :): {\displaystyle C} , which will increase Échec de l’analyse (MathML avec SVG ou PNG en secours (recommandé pour les navigateurs modernes et les outils d’accessibilité) : réponse non valide(« Math extension cannot connect to Restbase. ») du serveur « https://en.wikipedia.org/api/rest_v1/ » :): {\displaystyle Y} , which will increase Échec de l’analyse (MathML avec SVG ou PNG en secours (recommandé pour les navigateurs modernes et les outils d’accessibilité) : réponse non valide(« Math extension cannot connect to Restbase. ») du serveur « https://en.wikipedia.org/api/rest_v1/ » :): {\displaystyle C} , etc...
The Keynesian multiplier says that Échec de l’analyse (MathML avec SVG ou PNG en secours (recommandé pour les navigateurs modernes et les outils d’accessibilité) : réponse non valide(« Math extension cannot connect to Restbase. ») du serveur « https://en.wikipedia.org/api/rest_v1/ » :): {\displaystyle \Delta Y = \frac {1}{1 - pmc} \frac {1}{1 - pmc} \delta G}
The greater the cpm, the greater the multiplier. If, on the other hand, the Échec de l’analyse (MathML avec SVG ou PNG en secours (recommandé pour les navigateurs modernes et les outils d’accessibilité) : réponse non valide(« Math extension cannot connect to Restbase. ») du serveur « https://en.wikipedia.org/api/rest_v1/ » :): {\displaystyle pmc = 0} , then the multiplier is equal to 1 and Échec de l’analyse (MathML avec SVG ou PNG en secours (recommandé pour les navigateurs modernes et les outils d’accessibilité) : réponse non valide(« Math extension cannot connect to Restbase. ») du serveur « https://en.wikipedia.org/api/rest_v1/ » :): {\displaystyle \Delta Y = \Delta G} (no amplification effect).
The Keynesian multiplier[modifier | modifier le wikicode]
If Échec de l’analyse (MathML avec SVG ou PNG en secours (recommandé pour les navigateurs modernes et les outils d’accessibilité) : réponse non valide(« Math extension cannot connect to Restbase. ») du serveur « https://en.wikipedia.org/api/rest_v1/ » :): {\displaystyle G} increases, Échec de l’analyse (MathML avec SVG ou PNG en secours (recommandé pour les navigateurs modernes et les outils d’accessibilité) : réponse non valide(« Math extension cannot connect to Restbase. ») du serveur « https://en.wikipedia.org/api/rest_v1/ » :): {\displaystyle Y} increases, which will increase Échec de l’analyse (MathML avec SVG ou PNG en secours (recommandé pour les navigateurs modernes et les outils d’accessibilité) : réponse non valide(« Math extension cannot connect to Restbase. ») du serveur « https://en.wikipedia.org/api/rest_v1/ » :): {\displaystyle C} , which will increase Échec de l’analyse (MathML avec SVG ou PNG en secours (recommandé pour les navigateurs modernes et les outils d’accessibilité) : réponse non valide(« Math extension cannot connect to Restbase. ») du serveur « https://en.wikipedia.org/api/rest_v1/ » :): {\displaystyle Y} , which will increase Échec de l’analyse (MathML avec SVG ou PNG en secours (recommandé pour les navigateurs modernes et les outils d’accessibilité) : réponse non valide(« Math extension cannot connect to Restbase. ») du serveur « https://en.wikipedia.org/api/rest_v1/ » :): {\displaystyle C} , and so on...
Initial expenditure variation = Échec de l’analyse (MathML avec SVG ou PNG en secours (recommandé pour les navigateurs modernes et les outils d’accessibilité) : réponse non valide(« Math extension cannot connect to Restbase. ») du serveur « https://en.wikipedia.org/api/rest_v1/ » :): {\displaystyle \Delta G = \Delta Y} First change in consumption = Échec de l’analyse (MathML avec SVG ou PNG en secours (recommandé pour les navigateurs modernes et les outils d’accessibilité) : réponse non valide(« Math extension cannot connect to Restbase. ») du serveur « https://en.wikipedia.org/api/rest_v1/ » :): {\displaystyle pmc \Delta G} Second change in consumption = Échec de l’analyse (MathML avec SVG ou PNG en secours (recommandé pour les navigateurs modernes et les outils d’accessibilité) : réponse non valide(« Math extension cannot connect to Restbase. ») du serveur « https://en.wikipedia.org/api/rest_v1/ » :): {\displaystyle pmc^2 \Delta G} Third variation in consumption = Échec de l’analyse (MathML avec SVG ou PNG en secours (recommandé pour les navigateurs modernes et les outils d’accessibilité) : réponse non valide(« Math extension cannot connect to Restbase. ») du serveur « https://en.wikipedia.org/api/rest_v1/ » :): {\displaystyle pmc^3 \times \Delta G}
- Échec de l’analyse (MathML avec SVG ou PNG en secours (recommandé pour les navigateurs modernes et les outils d’accessibilité) : réponse non valide(« Math extension cannot connect to Restbase. ») du serveur « https://en.wikipedia.org/api/rest_v1/ » :): {\displaystyle \Delta Y = (1 + pmc + pmc^2 + pmc^3 + ...) \times \Delta G}
The Keynesian multiplier for public spending is therefore :
- Échec de l’analyse (MathML avec SVG ou PNG en secours (recommandé pour les navigateurs modernes et les outils d’accessibilité) : réponse non valide(« Math extension cannot connect to Restbase. ») du serveur « https://en.wikipedia.org/api/rest_v1/ » :): {\displaystyle \frac {\Delta Y}{\Delta G} = (1 + pmc + pmc^2 + pmc^3 + ...) = \frac {\Delta Y}{\Delta G} = \frac {1}{1 - pmc}}
Échec de l’analyse (MathML avec SVG ou PNG en secours (recommandé pour les navigateurs modernes et les outils d’accessibilité) : réponse non valide(« Math extension cannot connect to Restbase. ») du serveur « https://en.wikipedia.org/api/rest_v1/ » :): {\displaystyle (1 + pmc + pmc^2 + pmc^3 + ...)} is an infinite geometric sequence of reason Échec de l’analyse (MathML avec SVG ou PNG en secours (recommandé pour les navigateurs modernes et les outils d’accessibilité) : réponse non valide(« Math extension cannot connect to Restbase. ») du serveur « https://en.wikipedia.org/api/rest_v1/ » :): {\displaystyle 0 < pmc < 1}
Keynesian multiplier: notes[modifier | modifier le wikicode]
The multiplier effect also works with any other component of income. For example, if Échec de l’analyse (MathML avec SVG ou PNG en secours (recommandé pour les navigateurs modernes et les outils d’accessibilité) : réponse non valide(« Math extension cannot connect to Restbase. ») du serveur « https://en.wikipedia.org/api/rest_v1/ » :): {\displaystyle X} increases because RoW is in a boom (and Y*↑), the increase of Échec de l’analyse (MathML avec SVG ou PNG en secours (recommandé pour les navigateurs modernes et les outils d’accessibilité) : réponse non valide(« Math extension cannot connect to Restbase. ») du serveur « https://en.wikipedia.org/api/rest_v1/ » :): {\displaystyle Y} will be greater than the initial increase of Échec de l’analyse (MathML avec SVG ou PNG en secours (recommandé pour les navigateurs modernes et les outils d’accessibilité) : réponse non valide(« Math extension cannot connect to Restbase. ») du serveur « https://en.wikipedia.org/api/rest_v1/ » :): {\displaystyle X} . And it also applies to a decrease in the level of spending (a decrease of Échec de l’analyse (MathML avec SVG ou PNG en secours (recommandé pour les navigateurs modernes et les outils d’accessibilité) : réponse non valide(« Math extension cannot connect to Restbase. ») du serveur « https://en.wikipedia.org/api/rest_v1/ » :): {\displaystyle X} will have an amplified impact on Échec de l’analyse (MathML avec SVG ou PNG en secours (recommandé pour les navigateurs modernes et les outils d’accessibilité) : réponse non valide(« Math extension cannot connect to Restbase. ») du serveur « https://en.wikipedia.org/api/rest_v1/ » :): {\displaystyle Y} ).
Under the assumptions made so far, income is either consumed or saved by households => Échec de l’analyse (MathML avec SVG ou PNG en secours (recommandé pour les navigateurs modernes et les outils d’accessibilité) : réponse non valide(« Math extension cannot connect to Restbase. ») du serveur « https://en.wikipedia.org/api/rest_v1/ » :): {\displaystyle pmc + pms = 1} => the multiplier can also be written as Échec de l’analyse (MathML avec SVG ou PNG en secours (recommandé pour les navigateurs modernes et les outils d’accessibilité) : réponse non valide(« Math extension cannot connect to Restbase. ») du serveur « https://en.wikipedia.org/api/rest_v1/ » :): {\displaystyle \frac {1}{1 - pmc} = \frac {1}{pms}} .
Saving is not the only "leakage" in the income stream. If <math<M</math> is a function of Échec de l’analyse (MathML avec SVG ou PNG en secours (recommandé pour les navigateurs modernes et les outils d’accessibilité) : réponse non valide(« Math extension cannot connect to Restbase. ») du serveur « https://en.wikipedia.org/api/rest_v1/ » :): {\displaystyle Y} (which is the case), the multiplier will actually be smaller (part of the expenditure is on goods produced abroad) => Échec de l’analyse (MathML avec SVG ou PNG en secours (recommandé pour les navigateurs modernes et les outils d’accessibilité) : réponse non valide(« Math extension cannot connect to Restbase. ») du serveur « https://en.wikipedia.org/api/rest_v1/ » :): {\displaystyle \Delta Y = \frac {1}{pms + pmm} \delta G} , where Échec de l’analyse (MathML avec SVG ou PNG en secours (recommandé pour les navigateurs modernes et les outils d’accessibilité) : réponse non valide(« Math extension cannot connect to Restbase. ») du serveur « https://en.wikipedia.org/api/rest_v1/ » :): {\displaystyle pmm} is the marginal propensity to import.
Keynesian multiplier and tax system[modifier | modifier le wikicode]
Finally, note that in case of proportional income taxation (Échec de l’analyse (MathML avec SVG ou PNG en secours (recommandé pour les navigateurs modernes et les outils d’accessibilité) : réponse non valide(« Math extension cannot connect to Restbase. ») du serveur « https://en.wikipedia.org/api/rest_v1/ » :): {\displaystyle T = t \times Y} , where Échec de l’analyse (MathML avec SVG ou PNG en secours (recommandé pour les navigateurs modernes et les outils d’accessibilité) : réponse non valide(« Math extension cannot connect to Restbase. ») du serveur « https://en.wikipedia.org/api/rest_v1/ » :): {\displaystyle t} indicates the tax rate, then Échec de l’analyse (MathML avec SVG ou PNG en secours (recommandé pour les navigateurs modernes et les outils d’accessibilité) : réponse non valide(« Math extension cannot connect to Restbase. ») du serveur « https://en.wikipedia.org/api/rest_v1/ » :): {\displaystyle C = C_0 + pmc (1 - t) Y} ). In this case the Keynesian multiplier changes and, disregarding imports, becomes:
- Échec de l’analyse (MathML avec SVG ou PNG en secours (recommandé pour les navigateurs modernes et les outils d’accessibilité) : réponse non valide(« Math extension cannot connect to Restbase. ») du serveur « https://en.wikipedia.org/api/rest_v1/ » :): {\displaystyle {1}{1 - pmc (1 - t)}} .
Of course, if the share of revenue raised by the government in the form of taxes increases, the multiplier effect weakens.
Expenditure Function Slope[modifier | modifier le wikicode]
The slope of the expenditure function reflects the strength of the multiplier. The lower the multiplier (small pmc or high pms), the lower the slope of the expenditure function.
Impact of a ∆G[modifier | modifier le wikicode]
The lower the slope of the expenditure function (= low multiplier), the greater the change in public expenditure needed to bring about a certain desired change in income. N.B. Nevertheless, in both cases, Échec de l’analyse (MathML avec SVG ou PNG en secours (recommandé pour les navigateurs modernes et les outils d’accessibilité) : réponse non valide(« Math extension cannot connect to Restbase. ») du serveur « https://en.wikipedia.org/api/rest_v1/ » :): {\displaystyle \Delta Y > \Delta G} .
The liquidity preference theory[modifier | modifier le wikicode]
Money supply and demand[modifier | modifier le wikicode]
In Chapter 7 we analysed in detail the means used by the Central Bank (CB) to intervene in the money market. Despite the fact that the control exercised by the CB is far from perfect, we will make the hypothesis that the quantity of money offered in the economy is fixed at the level decided by the CB => exogenous supply (vertical Ms).
In chapter 8 we saw that the demand for money depends positively on the general price level (when prices increase, more money is needed to settle transactions) and the level of production (when production increases, transactions also increase and more money is needed to settle payments), and negatively on the interest rate (when Échec de l’analyse (MathML avec SVG ou PNG en secours (recommandé pour les navigateurs modernes et les outils d’accessibilité) : réponse non valide(« Math extension cannot connect to Restbase. ») du serveur « https://en.wikipedia.org/api/rest_v1/ » :): {\displaystyle r} increases, other forms of wealth holding become more interesting) => Échec de l’analyse (MathML avec SVG ou PNG en secours (recommandé pour les navigateurs modernes et les outils d’accessibilité) : réponse non valide(« Math extension cannot connect to Restbase. ») du serveur « https://en.wikipedia.org/api/rest_v1/ » :): {\displaystyle M^d = L(r_-, P_+, Y_+)} .
Still in chapter 8 we had drawn the money demand curve as a function of Échec de l’analyse (MathML avec SVG ou PNG en secours (recommandé pour les navigateurs modernes et les outils d’accessibilité) : réponse non valide(« Math extension cannot connect to Restbase. ») du serveur « https://en.wikipedia.org/api/rest_v1/ » :): {\displaystyle P} (or Échec de l’analyse (MathML avec SVG ou PNG en secours (recommandé pour les navigateurs modernes et les outils d’accessibilité) : réponse non valide(« Math extension cannot connect to Restbase. ») du serveur « https://en.wikipedia.org/api/rest_v1/ » :): {\displaystyle \frac {1}{P})} , given the interest rate Échec de l’analyse (MathML avec SVG ou PNG en secours (recommandé pour les navigateurs modernes et les outils d’accessibilité) : réponse non valide(« Math extension cannot connect to Restbase. ») du serveur « https://en.wikipedia.org/api/rest_v1/ » :): {\displaystyle r} , knowing that if Échec de l’analyse (MathML avec SVG ou PNG en secours (recommandé pour les navigateurs modernes et les outils d’accessibilité) : réponse non valide(« Math extension cannot connect to Restbase. ») du serveur « https://en.wikipedia.org/api/rest_v1/ » :): {\displaystyle r} falls (increases) it is the whole money demand function that moves up (down).
Preference for liquidity[modifier | modifier le wikicode]
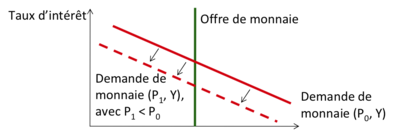
In a short-term dispute prices are relatively rigid. It then makes more sense to draw the money demand curve as a function of the interest rate, given the price level P → decreasing relationship → monetary theory of liquidity preference.
This relationship allows us to see very clearly that, given the supply of money, when the general price level falls, the demand for money in turn falls and causes a reduction in the interest rate. The same effect on the interest rate is observed if the supply of money increases.
What interest rate?[modifier | modifier le wikicode]
As discussed in Chapters 3 and 8, economists distinguish between nominal and real interest rates, the former being the normally announced rate and the latter the inflation-adjusted rate.
What is the interest rate determined in the money market? The answer is: both.
By the way, when we are in a short-term dispute, inflation expectations are constant (hp of sticky prices). Consequently, any change in the nominal interest rate translates into an identical change in the real interest rate. It is therefore indifferent to put Échec de l’analyse (MathML avec SVG ou PNG en secours (recommandé pour les navigateurs modernes et les outils d’accessibilité) : réponse non valide(« Math extension cannot connect to Restbase. ») du serveur « https://en.wikipedia.org/api/rest_v1/ » :): {\displaystyle i} or Échec de l’analyse (MathML avec SVG ou PNG en secours (recommandé pour les navigateurs modernes et les outils d’accessibilité) : réponse non valide(« Math extension cannot connect to Restbase. ») du serveur « https://en.wikipedia.org/api/rest_v1/ » :): {\displaystyle r} on the vertical axis of the graph representing the money market (depending on the sources, one can find both).
In the short term, prices do not adjust quickly. It is therefore another variable (the interest rate) that ensures equilibrium in the money market in the event of a shock.
The IS-LM model[modifier | modifier le wikicode]
The IS-LM model[modifier | modifier le wikicode]
The IS-LM model proposed by John Hicks is used to determine the simultaneous equilibrium in the goods and services (B&S) and money markets. Specifically, the IS-LM model allows us to find the combinations of income and interest rates that guarantee the general equilibrium of the economy. In addition, this model will also allow us to analyse the balance impacts of fiscal and monetary policy interventions.
The IS curve (Échec de l’analyse (MathML avec SVG ou PNG en secours (recommandé pour les navigateurs modernes et les outils d’accessibilité) : réponse non valide(« Math extension cannot connect to Restbase. ») du serveur « https://en.wikipedia.org/api/rest_v1/ » :): {\displaystyle I} for investment and Échec de l’analyse (MathML avec SVG ou PNG en secours (recommandé pour les navigateurs modernes et les outils d’accessibilité) : réponse non valide(« Math extension cannot connect to Restbase. ») du serveur « https://en.wikipedia.org/api/rest_v1/ » :): {\displaystyle S} for savings) summarizes all the combinations of income and interest rates that ensure equilibrium on the B&S → market inverse relationship between Échec de l’analyse (MathML avec SVG ou PNG en secours (recommandé pour les navigateurs modernes et les outils d’accessibilité) : réponse non valide(« Math extension cannot connect to Restbase. ») du serveur « https://en.wikipedia.org/api/rest_v1/ » :): {\displaystyle Y} and the interest rate. See next page.
The LM curve (Échec de l’analyse (MathML avec SVG ou PNG en secours (recommandé pour les navigateurs modernes et les outils d’accessibilité) : réponse non valide(« Math extension cannot connect to Restbase. ») du serveur « https://en.wikipedia.org/api/rest_v1/ » :): {\displaystyle L} for liquidity and Échec de l’analyse (MathML avec SVG ou PNG en secours (recommandé pour les navigateurs modernes et les outils d’accessibilité) : réponse non valide(« Math extension cannot connect to Restbase. ») du serveur « https://en.wikipedia.org/api/rest_v1/ » :): {\displaystyle M} for currency) summarizes all the combinations of income and interest rates that ensure equilibrium on the currency market → direct relation between Échec de l’analyse (MathML avec SVG ou PNG en secours (recommandé pour les navigateurs modernes et les outils d’accessibilité) : réponse non valide(« Math extension cannot connect to Restbase. ») du serveur « https://en.wikipedia.org/api/rest_v1/ » :): {\displaystyle Y} and the interest rate. See below.
The IS curve[modifier | modifier le wikicode]
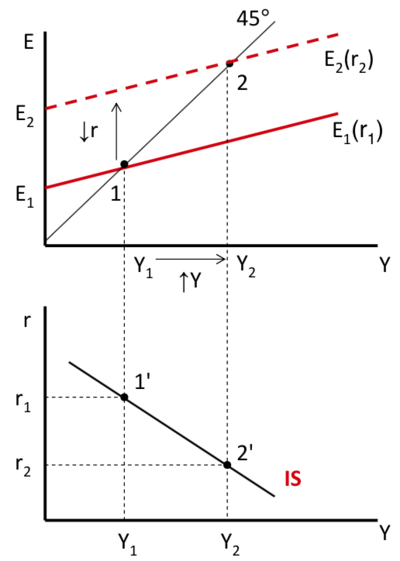
Initial equilibrium: 1 and 1' → fall in r → interest-sensitive components of total expenditure (C and I) increase → shift of E upwards → new equilibrium: 2 and 2'.
Linking the points 1' and 2' in the bottom graph gives the IS curve = set of equilibria on the B&S market associated with different income and interest rate levels.
The slope of the IS curve reflects the responsiveness of C and I to changes in r.
Any increase (decrease) in an exogenous component of the expenditure, as well as G and X, causes the IS curve to shift to the right (left).
The LM curve[modifier | modifier le wikicode]
Starting equilibrium: 1 and 1'→ increase of Y → moving Échec de l’analyse (MathML avec SVG ou PNG en secours (recommandé pour les navigateurs modernes et les outils d’accessibilité) : réponse non valide(« Math extension cannot connect to Restbase. ») du serveur « https://en.wikipedia.org/api/rest_v1/ » :): {\displaystyle M^d} upwards → being Échec de l’analyse (MathML avec SVG ou PNG en secours (recommandé pour les navigateurs modernes et les outils d’accessibilité) : réponse non valide(« Math extension cannot connect to Restbase. ») du serveur « https://en.wikipedia.org/api/rest_v1/ » :): {\displaystyle M^S} fixed, new equilibrium: 2 and 2'.
By connecting points 1' and 2' in the graph on the right, we obtain the LM curve = all combinations of income and equilibrium interest rates on the money market.
The slope of the LM curve reflects the sensitivity of Échec de l’analyse (MathML avec SVG ou PNG en secours (recommandé pour les navigateurs modernes et les outils d’accessibilité) : réponse non valide(« Math extension cannot connect to Restbase. ») du serveur « https://en.wikipedia.org/api/rest_v1/ » :): {\displaystyle M^d} to changes in Y.
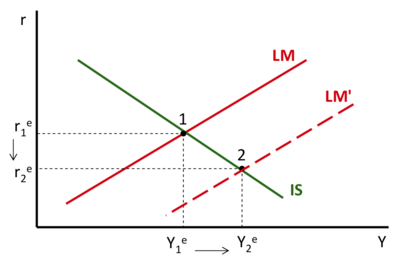
Any increase (decrease) in the money supply causes the LM curve to move down (up).
The general equilibrium[modifier | modifier le wikicode]
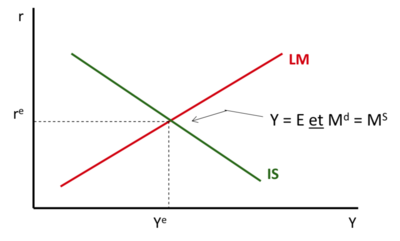
The simultaneous equilibrium of the G&S market and the money market occurs at the intersection of the IS curve and the LM curve :
Budgetary policy[modifier | modifier le wikicode]
Government decides to increase public spending to stimulate the economy (for an analysis of fiscal policy, see also Chapter 13): G↑ → shifting SI to the right → Y↑ and r↑ (new balance in point 2)
Intuition: the increase in income caused by increased public spending increases the demand for money, which, at money supply parity, leads to an increase in r.
NB: we would have had the same type of result if, instead of increasing spending, the government had reduced taxes.
Monetary policy[modifier | modifier le wikicode]
BC decides to increase the money supply (for an analysis of monetary policy, see also chapter 13): Échec de l’analyse (MathML avec SVG ou PNG en secours (recommandé pour les navigateurs modernes et les outils d’accessibilité) : réponse non valide(« Math extension cannot connect to Restbase. ») du serveur « https://en.wikipedia.org/api/rest_v1/ » :): {\displaystyle M^S} ↑ → shift of the LM to the right → r↓ and Y↑ (new balance at point 2)
Intuition: the increase in the supply of money leads to a fall in the interest rate, which stimulates consumer and investment spending and therefore increases Y.
Summary[modifier | modifier le wikicode]
With the publication of Keynes' General Theory, for the first time the role of the state in stabilizing economic activity was put forward and defended by most economists.
The 45° model shows that the equilibrium condition on the G&S market, Y = E, is not necessarily achieved at the level of full employment production.
The increase (or decrease) in government demand has a magnified impact on income because of multiplier effects.
The liquidity preference theory emphasises that, for a given price level, the demand for money depends inversely on the interest rate (= opportunity cost of holding wealth in liquid form).
The general equilibrium of the economic system is achieved at the intersection of the IS curve and the LM curve.
The IS curve represents the set of "interest rate - income" combinations that ensure equilibrium on the B&S market. The LM curve represents the set of "interest rate - income" combinations that ensure equilibrium on the money market.
Fiscal and monetary policies cause shifts in the IS and LM curves and therefore have an impact on economic equilibrium.
Annexes[modifier | modifier le wikicode]
References[modifier | modifier le wikicode]
- ↑ Page personnelle de Federica Sbergami sur le site de l'Université de Genève
- ↑ Page personnelle de Federica Sbergami sur le site de l'Université de Neuchâtel
- ↑ Page personnelle de Federica Sbergami sur Research Gate
- ↑ Researchgate.net - Nicolas Maystre
- ↑ Google Scholar - Nicolas Maystre
- ↑ VOX, CEPR Policy Portal - Nicolas Maystre
- ↑ Nicolas Maystre's webpage
- ↑ Cairn.info - Nicolas Maystre
- ↑ Linkedin - Nicolas Maystre
- ↑ Academia.edu - Nicolas Maystre


